Accuracy Metrics
Each quarter, SafeGraph evaluates the quality and completeness of our US POI data using two key metrics, calculated based on randomly chosen zip codes.
- Coverage Rate: The percentage of SafeGraph POIs compared to the industry standard. In the US, this is Google.
- Real Open Rate: The percent of SafeGraph POIs we estimate to be real and currently open.
Of course, not all zip codes will be the same. The two chosen are meant to represent one urban area and one more rural area. Some will be better representations than others. But the random sampling and continued quarterly measurement should provide as good a measuring stick as any. You can find plenty of additional information on our metric definitions, methodologies and approach here: Metric Methodologies
And even more information about our approach to data validation and veracity in our Accuracy section.
Q2 2026 Metrics (April Places Release)
This quarter, we're looking at the following zip codes:
- 96815: Honolulu, HI - Representative of Urban
- 96712: Haleiwa, HI - Representative of Rural
Here's the breakdown:
| Geo Aggregation | Coverage Rate ** | Real Open Rate |
|---|---|---|
| Total Sample | 86% | 70% |
| 96815 (Urban) | 84% | 68% |
| 96712 (Rural) | 98% | 75% |
| Category Aggregation (NAICS) | Coverage Rate ** | Real Open Rate |
|---|---|---|
| 44-45 Retail Trade | 60% | 63% |
| Urban | 61% | 62% |
| Rural | 56% | 72% |
| 71 Arts, Entertainment, and Recreation | 123% | 79% |
| Urban | 111% | 78% |
| Rural | 147% | 81% |
| 72 Accommodations and Food Services | 68% | 80% |
| Urban | 67% | 80% |
| Rural | 68% | 82% |
| 81 Other Services | 100% | 71% |
| Urban | 97% | 70% |
| Rural | 117% | 72% |
** When coverage rate is >100%, it implies that SafeGraph was measured to have more real and open places than the benchmark (Google) in the given zip code.
** Note Coverage Rate can be skewed higher if the matching overlap between the two sources is low. See the Overlap Analysis for additional detail.
Interested in a particular zip code for a future quarter? We're taking suggestions!
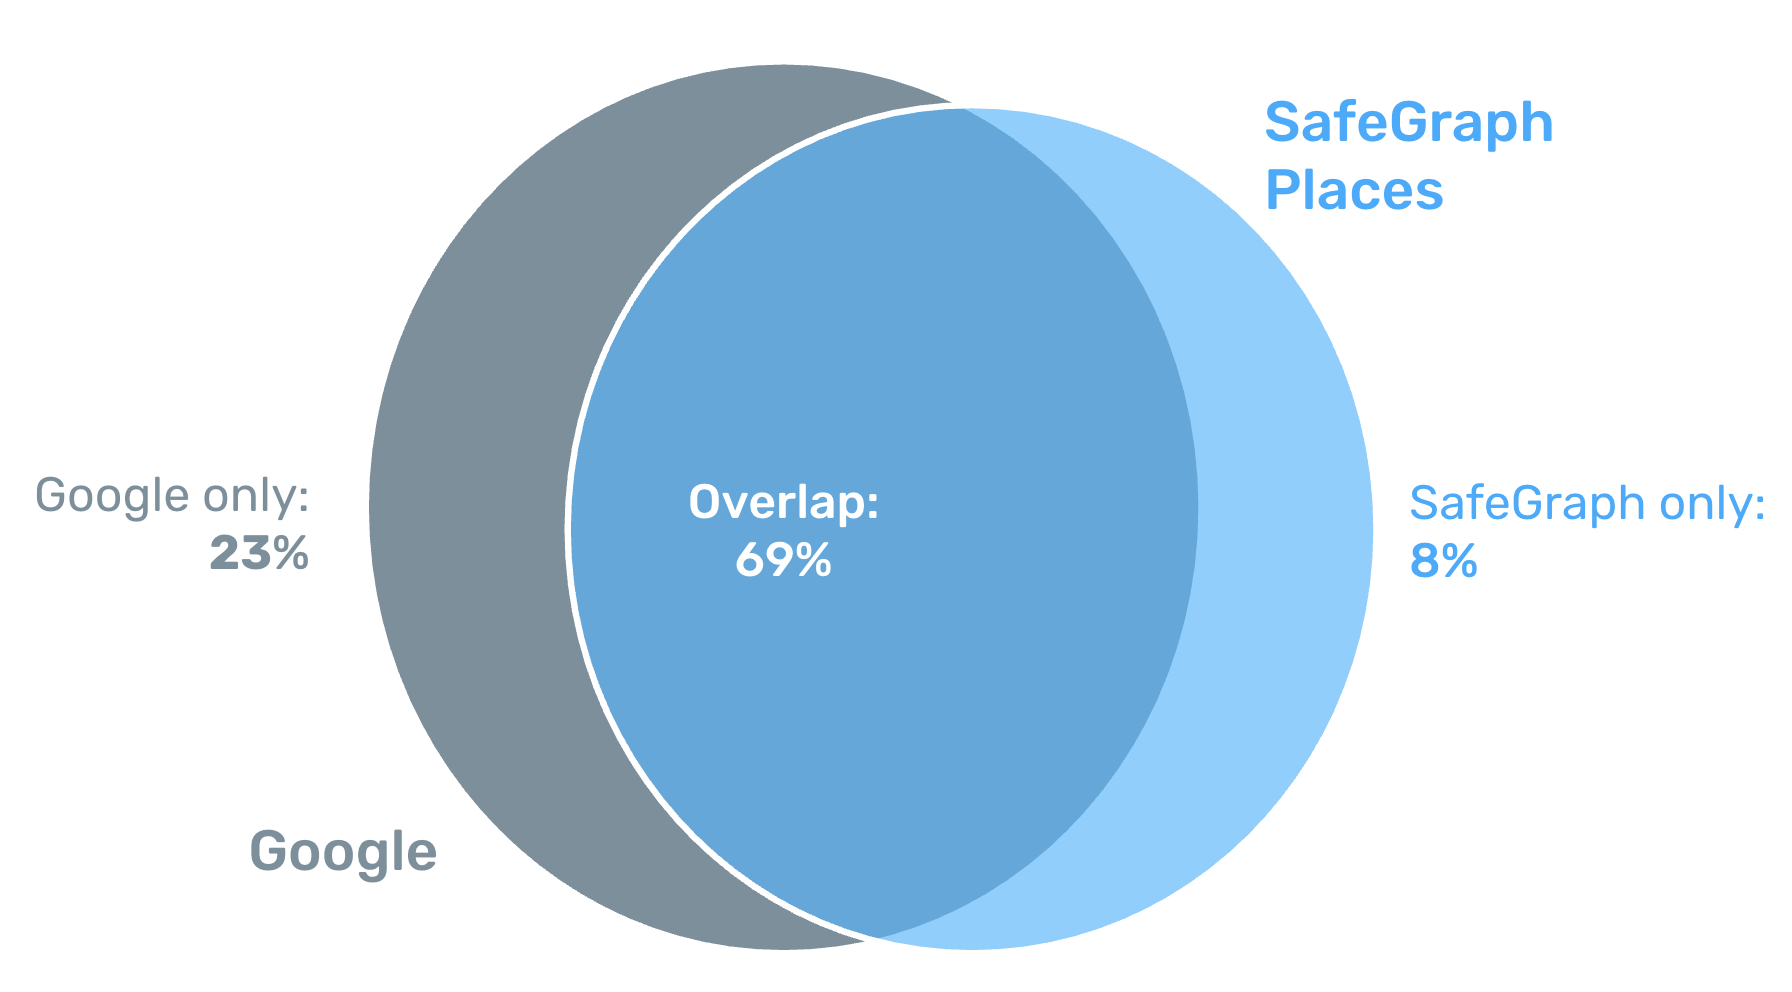
Overlap Analysis
Using the sampled data, we've compared the total overlap of our data in the two zip codes with the same zip codes from Google, marking those that are unique to each dataset.
Updated 4 months ago