Evaluating SafeGraph Data
Use this page to work through your evaluation of SafeGraph data. We've also built a Google Colab notebook if that's more your style.
This evaluation addresses the three major quality categories when evaluating point of interest (POI) data: precision, recall, and completeness. Methodology and detailed results for each metric can be found in their corresponding sections.
| Category | Metric | Result |
|---|---|---|
| Precision | Latitude & Longitude Accuracy | Good results should be 0 - 10 meters away from truth set (Google Maps). |
| Precision | Polygon Accuracy | Good results should show > 70% of tested polygons are true to building footprint as represented by truth set (Google Maps). |
| Precision | Attribute Accuracy | Good results should show > 99.9% of POI attributes for top brands are accurate as compared to truth set (online store locators). |
| Recall | Total POI count for categories | Benchmark category counts against Census data |
| Recall | Total POI count for selected brands | Good results should show POI counts for brands/chains are within 0 - 2% of tested truth set (store locators). |
| Completeness | Attribute Counts (All POI) | Good results should show high fill rates for important attributes Category: > 90% Phone Number: > 70% Open Hours: > 50% These should be even higher for major brands (chains). |
Methodologies and Example Results
Precision: Latitude and Longitude Accuracy
Are SafeGraph Places actually located where they purport to be?
Methodology
Every POI in the SafeGraph Places dataset includes columns for the interpolated latitude & longitude values for a POI. A coordinate accuracy measurement compares the SafeGraph coordinate values to an accepted coordinate truth set (Google Maps).
To measure the distance between SafeGraph and Google POI coordinates, we recommend the Google Places API to make Find Places requests for all POI in the SafeGraph dataset. More specifically, we provide the address for all SafeGraph POIs and compare the returned Google coordinates to the associated SafeGraph POI coordinates. The distance between coordinates is measured in meters.
Results
In aggregate, we find that the median distance between SafeGraph and Google Maps coordinates for all SafeGraph POIs is very small (usually 0-5m). The distribution of POI distance from Google Maps is presented below:

In contrast, we've found that other POI data providers show centroid precision ranging from 18-65 meters in median distance from Google Maps with a mean median distance of 40 meters.
Precision: Polygon Accuracy
Do SafeGraph Places Polygons represent the exact shape of buildings?
Methodology
The SafeGraph Places dataset includes two fields that describe POI geometry:
polygon_wkt: a polygon that represents the shape of the POI, formatted as Well-Known Text (WKT).polygon_class: a field that describes whether the polygon describes the POI itself (owned_polygon) or if the polygon is shared by more than one POI (shared_polygon).
To measure the accuracy of polygons, filter to polygons that represent a single POI by only including owned_polygon values for the polygon_class. Select a random subset of (e.g. 1,000) POIs in the dataset for human verification. For each selected polygon, a tester can overlay the polygon on top of Google Maps and score in a binary manner whether a polygon accurately represented the shape of a building. A polygon can be determined as accurate when:
- The polygon represents the associated POI in the dataset. Inversely, a polygon is inaccurate if it was the correct shape of a building but associated with the wrong POI.
- The polygon accurately covers the building footprint of interest in both shape and size.
- If a POI is part of a larger structure (such as a strip mall), the polygon should accurately represent the shape and size of the individual store.
- Polygons were only determined to be accurate if they were within 2 meters of the Google Maps imagery as this discrepancy can be accounted for in differing pitches of satellite imagery.
When inaccurate, the polygons can be classified into the following inaccurate categories:
- Centroid: the tested data was a not a building polygon but rather an approximated circular polygon derived from the POI centroid with a radius applied
- Shape: the polygon was the wrong shape compared to the POI.
- Size: the polygon was either smaller or larger than the POI.
- Wrong Place: the polygon did not represent correct POI even if it was the correct shape and size of a building.
Examples of correct and incorrect polygons are shown below:
Accurate Examples
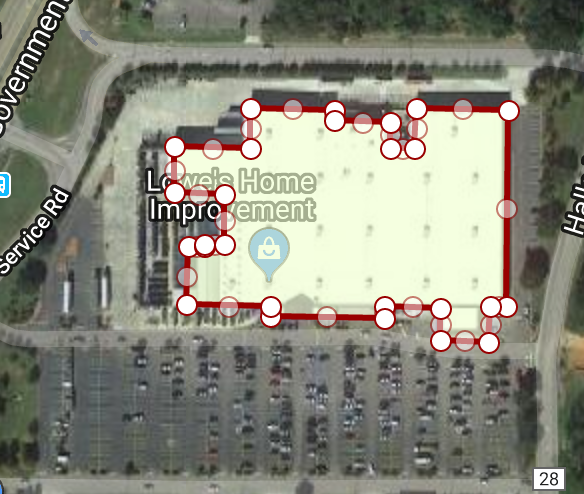
Accurate location, shape and size.
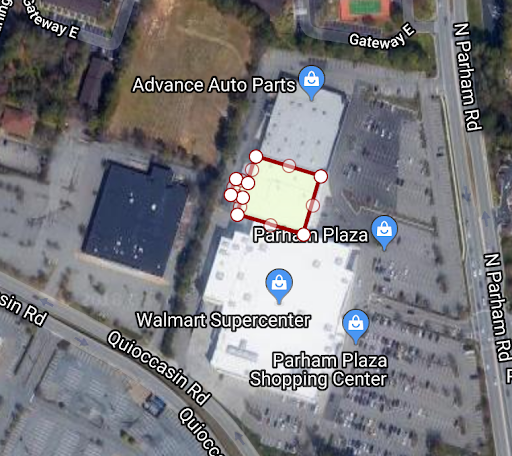
Accurate location, shape and size within the context of a strip mall.
Innaccurate Examples
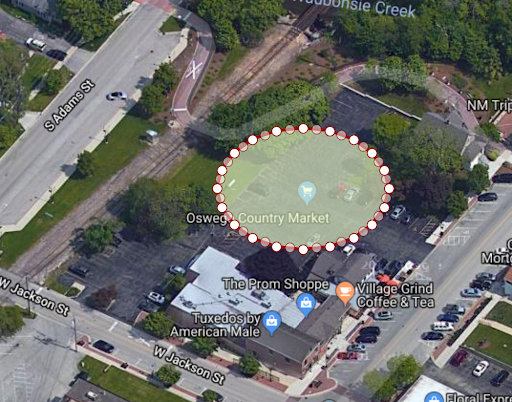
Wrong place as it represents a structure that doesn't exist.
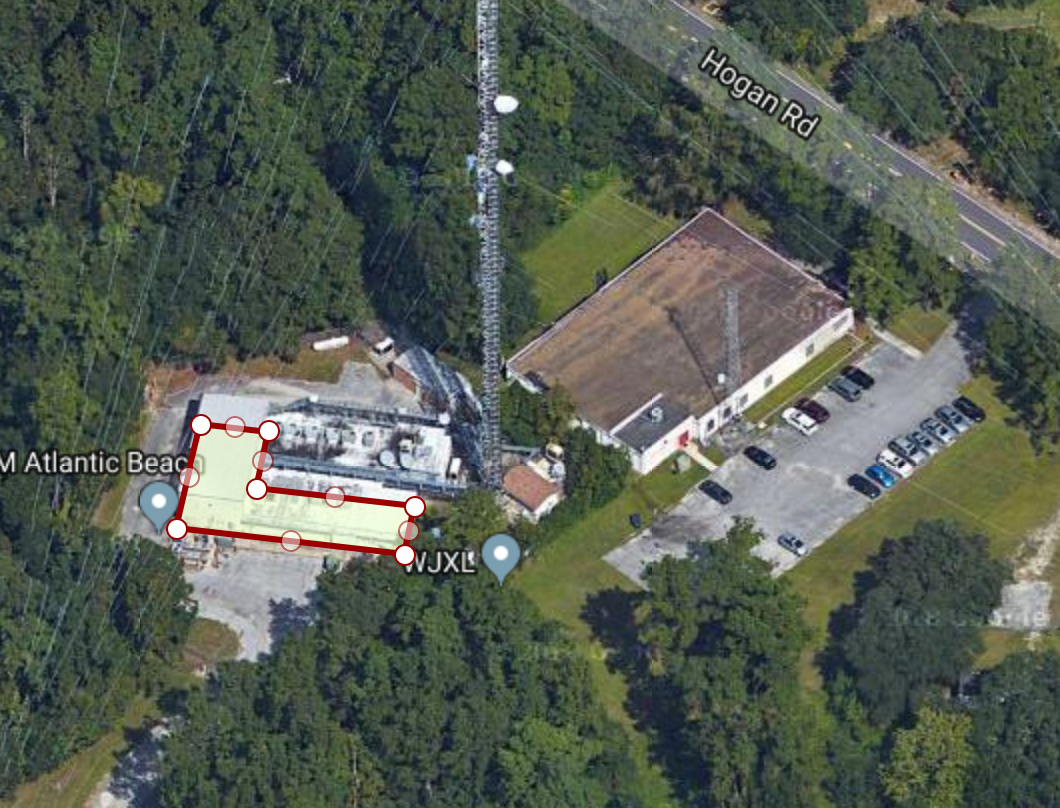
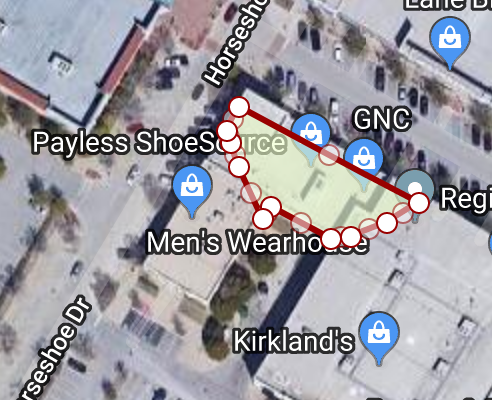
Accurate shape and size for selected building (within 2m) but wrong POI (address is for the other building).
Correct location but inaccurate shape and size (includes more than one store in a strip mall).
Precision: Attribute Accuracy (Address, Phone Number, Open Hours)
Are POIs associated with accurate business information (address, phone number, open hours, etc.)?
Methodology
Each SafeGraph place includes the following business information:
location_namestreet_addresscitystatezip_code
Most SafeGraph Places also include:
naics_codephone_numberopen_hours
(See Places Counts and Fill Rates for broader overview.
To estimate the accuracy of this business metadata, you can create a randomized subset of POI that includes all attributes of interest:
- e.g., Select 50 random brands from the dataset where their store count is greater than 1,000 stores nationally. Select 10 random stores for each of those brands where all attributes were included.
This randomized subset of branded POI can be compared to the data provided by online corporate websites for each of these brands by human verifiers. For example, the Lowe’s brand can be tested against the truth set provided at <https://www.lowes.com/store/>.
The NAICS code for the 50 random brands selected can be verified by human judgment.
Recall: POI Count per category
How representative are SafeGraph Places across categories?
Methodology - US POI
To assess the accuracy of POI counts per category, calculate the total of open POI per category (using the first 4 digits of the naics_code and safegraph_category) and compare against census data.
US Census publishes the SUSB (Statistics of United States Businesses) Annual Data Tables by Establishment Industry which provides establishment counts per industry. Some filtering of data is required to address the caveats below. See their methodology and glossary for further details.
| Caveat | Description | Required filters | |
|---|---|---|---|
| Data freshness | The latest US Census data is from 2018 | ||
| Definition of an establishment | An establishment is a single physical location at which business is conducted or services or industrial operations are performed | Exclude point-only POI using geometry_type and closed POI using closed_on. Excludenaics_codestarting with : 2361, 238, 531, 541, 5617, 8137, related to building contractors, services for real estate, professional consultants and professional interest groups, which are often conducted from a residential address, which SafeGraph omits. | |
| Inclusions | The US Census relies on the the Business Register (BR) which contains a record for each known establishment that is located in the United States with paid employees | Exclude naics_code: 531110, 712190, 812220 for apartment buildings, parks and cemeteries | |
| Exclusions | The series excludes data on self-employed individuals, employees of private households, railroad employees, agricultural production employees, and most government employees | Exclude naics_code starting with: 4821, 4841, 4911, 92 for the Postal Service, various government departments and rail transportation | |
| Categorization | The US Census determines the category of an establishment based on NAICS sector in which it paid the largest share of its payroll |
Results - US POI
Observing the comparison of SafeGraph open POI counts against the US Census establishments counts, we can see a lot of overlap across categories. However there are factors which can help explain the differences in some categories:
Categories where SafeGraph has a higher POI count:
- The latest US Census data for this report is from 2018, whereas SafeGraph releases Places data each month, where we source new brands and track when POI open or close.
- This US Census report only counts establishments with paid employees, which excludes POI are run by volunteers, such as
8131: Religious Organizationsor establishments run by self-employed individuals, like8121: Personal Care Services.
Categories where SafeGraph has a lower POI count:
- Some categories, such as industrial POI, are harder to source high quality data. SafeGraph continues to aggregate data from a wide range of sources, including publicly available data or partnering with vendors.
- The US Census includes businesses that are conducted in a residential address, which SafeGraph omits.
Other considerations:
- Differences in category counts can also be attributed to how the US Census determines the category of an establishment based on NAICS sector in which it paid the largest share of its payroll. Whereas SafeGraph uses its own category model.
Methodology - CA POI
Canada Census publishes Canadian Business Counts, with employees, by category. Some filtering is required to address the caveats below. See their methodology and details about their Business Register.
| Caveat | Description | Required filters | |
|---|---|---|---|
| Data freshness | The report is updated twice a year | ||
| Definition of business | CA Census relies on the Business Register, which are all active Canadian businesses | Exclude point-only POI using geometry_type and closed POI using closed_on | |
| Inclusions | Businesses that have a corporate income tax account, an employer payroll deduction remittance account, a GST/HST account, a T5013 partnership account, or a registered charities account. Persons reporting business income on personal tax forms are also included | Exclude naics_code starting with: 2361, 2362, 238, 4841, 4842, 5239, 531, 541, 5617, 6244, 8134, 8139, related to building contractors, services for real estate, professional consultants and professional interest groups, which are often conducted online or from a residential address, which SafeGraph omits. | |
| Exclusions | This report only includes businesses with at least one employee, which excludes businesses that are wholly run by the owner and do not have additional employees. | Exclude naics_code: 531110, 712190, 812220 for apartment buildings, parks and cemeteries respectively | |
| Categorization | CA Census uses automated coding software evaluates the activity description indicated by the business and assigns the appropriate industry classification coding |
Results - CA POI
Observing the comparison of SafeGraph open POI counts against the CA Census businesses counts, we can see a lot of overlap across categories. However there are factors which can help explain the differences in some categories:
Categories where SafeGraph has a higher POI count:
- This US Census report only counts businesses with employees, which excludes businesses run by self-employed individuals, like
8121: Personal Care Services.
Categories where SafeGraph has a lower POI count:
- Some categories, such as healthcare or industrial POI, are harder to source high quality data. SafeGraph continues to aggregate data from a wide range of sources, including publicly available data or partnering with vendors.
- The CA Census includes businesses that are conducted online or in a residential address, which SafeGraph omits.
Other considerations:
- Differences in category counts can also be attributed to how the CA Census determines the category of an establishment, based on its own coding software. Whereas SafeGraph uses its own category model.
Recall: Total POI Count for Selected Brands
Does SafeGraph Places include all POI for selected brands?
Methodology
To assess the accuracy of branded POI counts, generate a randomized sample of 20 safegraph_brand_ids where store counts were greater than 1,000 stores nationally and measure the total count of POI for each brand. For each brand, the SafeGraph Places count can be compared to the count of stores listed on the brand’s store locator site. Note determining the number of stores listed on the brand’s store locator website may require building a custom website scraping solution.
Completeness: Attribute Counts
What coverage does SafeGraph places offer and what are the fill rates for POI attributes?
Methodology
For example, you may want to examine the completeness of data coverage for high-value attributes like:
naics_codephone_numberopen_hours
Fill rate is defined as the percentage of non-null values for the attribute of interest in the dataset which can be computed with a simple query.
Please see Places Summary Statistics for a complete list of attribute counts and fill rates for the latest SafeGraph Places release. We recommend examining fill rates both overall and for high-value major retail chains (brands).
Updated about 1 year ago