Patterns Summary Statistics
Legacy ProductThis page references SafeGraph Patterns, Weekly Patterns, and/or Neighborhood Patterns, legacy products that will no longer be available at the start of 2023. If you are interested in foot traffic data, please contact us and we can refer you to a mobility data partner.
Welcome to SafeGraph’s Patterns Summary Statistics, a collection of stats summarizing the most recent and relevant statistics. See metrics from the latest release, from the last 12 months, visit and visitor counts and more!
Contents:
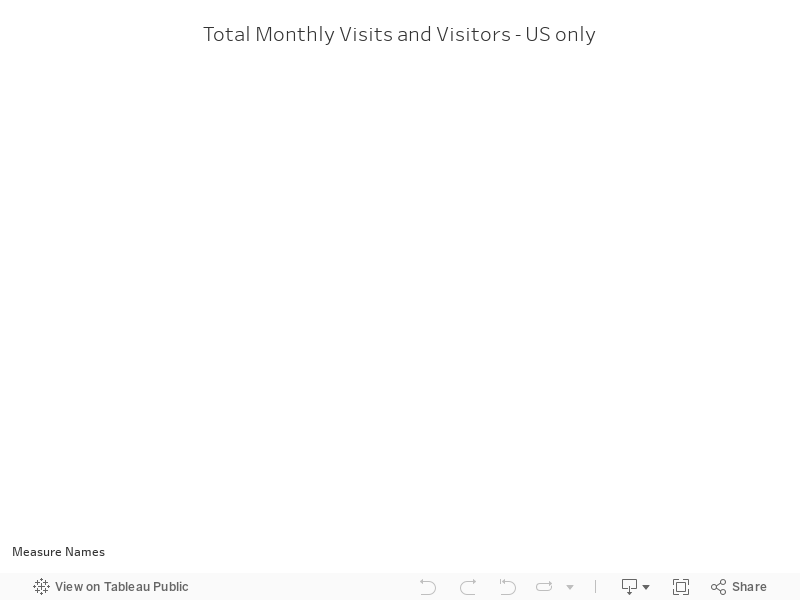
Monthly Patterns
Monthly Patterns only include US Patterns, however Canada Weekly Patterns are included in the next section.
A visit is counted if a mobile device in our panel dwells for at least 4 minutes at a given POI. Learn more about how we handle visits to enclosed POIs and other special cases here.

Visit counts are influenced by the geographic biases in our dataset and changes in the panel size over time. Each monthly delivery of Patterns includes the Panel Overview Data to enable normalization.
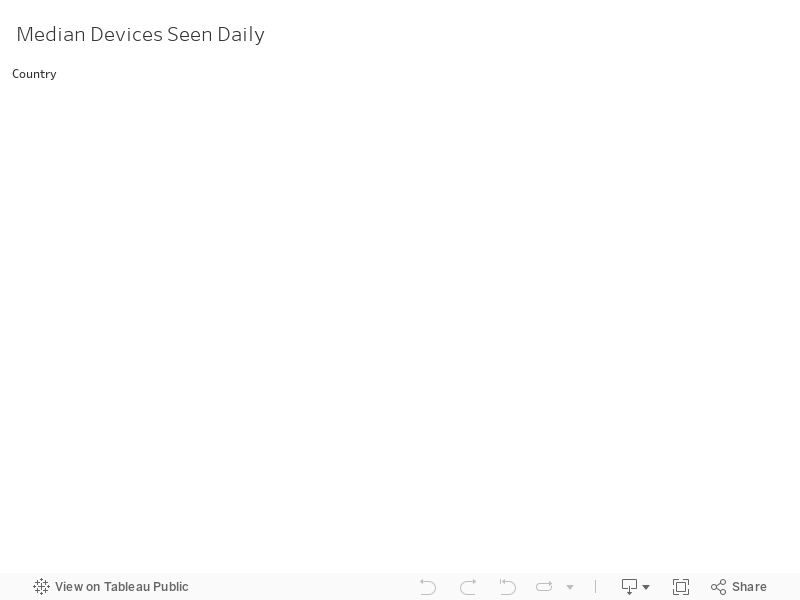
Median devices seen daily is calculated from total devices seen in the normalization statistics file provided with each month's release.

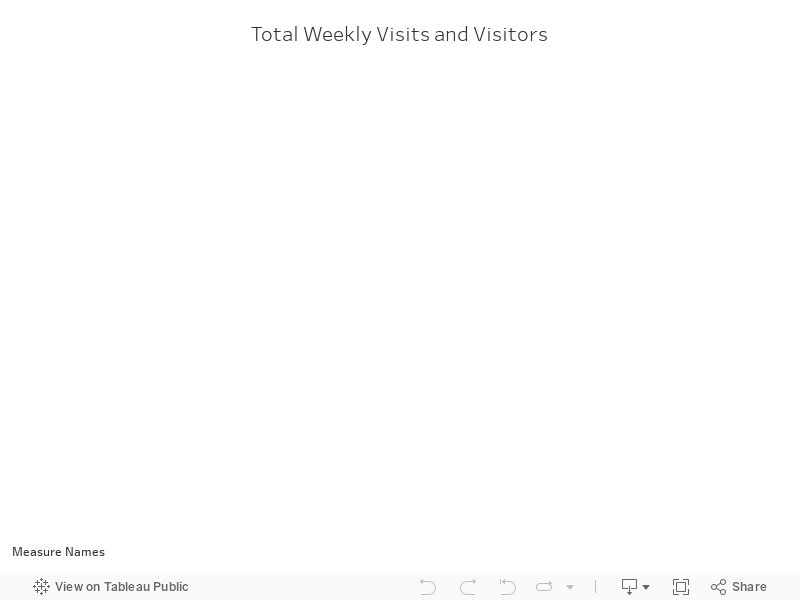
Weekly Patterns
Each delivery of Weekly Patterns covers one week starting Monday and ending end of day on Sunday. The data will be available three days later on Wednesday of each week, to enable more frequently delivery of actionable data. See Weekly Patterns to learn more about the schema and logic.
A visit is counted if a mobile device in our panel dwells for at least 4 minutes at a given POI. Learn more about how we handle visits to enclosed POIs and other special cases here.

Visit counts are influenced by the geographic biases in our dataset and changes in the panel size over time. Each monthly delivery of Patterns includes the Panel Overview Data to enable normalization.
Median devices seen daily is calculated from total devices seen in the normalization statistics file provided with each month's release.
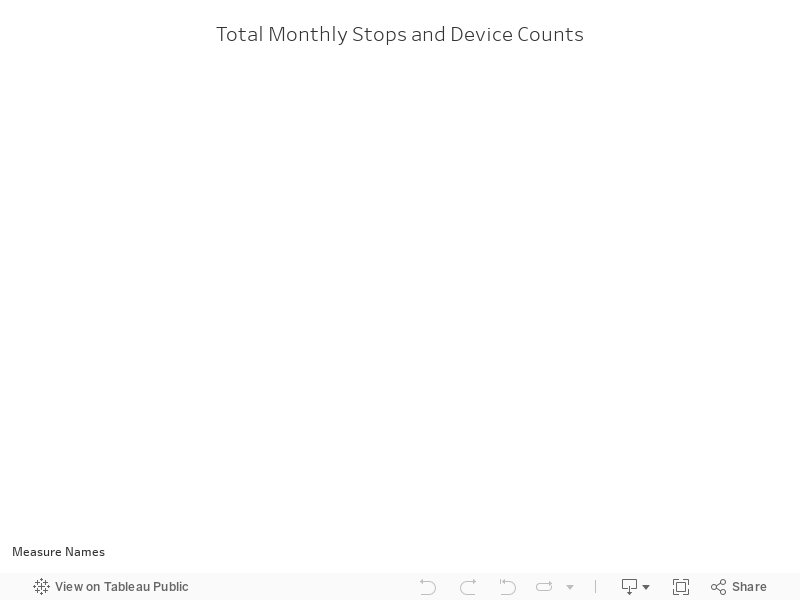
Neighborhood Patterns
SafeGraph’s Neighborhood Patterns dataset contains footfall data aggregated by census block group (CBG) in the US only. The data is released monthly (by the 7th) with each monthly release reflecting what occurred during the prior calendar month. See Neighborhood Patterns to learn more about the schema and underlying logic.
Updated about 1 year ago